Produced with assistance from David Horton Smith and published in Transnational Associations 30, 1978, 12, pp. 542-548. Paper presented to the workshop on new forms of presentation (Geneva, February 1979) of the Goals, Processes and Indicators of Development (GPID) project of the United Nations University, Human and Social Development Programme.
Summary
Horus stands for: Holistic Overview and Representation of Underlying Structure. This note responds to the problem encountered in meetings of many kinds when a complex of interrelated issues is discussed by participants having very different standpoints and approaches. Usually each participant's contribution is received politely, but very little is achieved towards linking it to others presented, especially when the papers and presentations are lengthy and somewhat difficult to digest. No satisfactory integrating perspective exists (a) to guide the evolution of the meeting; (b) to help participants to see the points of agreement and disagreement in context, or (c) to show participants what they have achieved (or failed to achieve). The note outlines a proposed method for maintaining and developing, during the course of a meeting, a visual representation or overview of the basic substantive points which are determining the evolution of the meeting. The method is presented here in a way which permits one or more different methods of representation to be selected for use on a particular occasion, depending on need.
Type of meeting
The display envisaged should be useful for a wide variety of meetings
- in a small group meeting (possibly within the meeting room as a wall display or on a blackboard)
- in a small conference (possibly located in the foyer, if not in the plenary room)
- in a large conference (in the foyer). In this description it is envisaged that the display could be used in:
- scientific meetings, in which "rational", "factual" presentations are made
- programme-oriented meetings, in which an attempt is being made to elaborate a programme of action
- other kinds of meetings, in which much greater emphasis may be placed on values, insights, people-participation, experiences, etc.
Limitations appear to be :
- if the meeting topics are perceived as well-ordered and treated as effectively separate (with no immediate interest or concern as to their interrelationship), then little purpose is served in trying to handle them all on one display. Separate displays could then be used for each topic, although in such cases there may be little desire or need to do so;
- if the presentations are by key resource people intending to inform participants, rather than to stimulate discussion and evoke immediate responses, there may be little motivation for preparing such a display or observing it. This would tend to apply in the case of many conventional meetings.
Use of the display is indicated when :
- part of the concern of the meeting is to interrelate complex issues, presented by people with very different viewpoints and approaches, to participants with differing viewpoints and sympathies;
- it is intended that interaction between participants should move the whole meeting towards a new level of understanding whose gradual emergence needs to be supportively represented;
- there is concern that discussion may drift from point to point, stimulated by each presentation, and that the challenge and opportunity of the compatibility and incompatibility between points will not result in any creative response leading to the emergence of a new level of significance or synthesis;
- part of the difficulty lies with finding a more meaningful method of ordering the predefined issues and relating them to those which emerge during discussion;
- participants are prepared to recognize the reality of the dynamics opposing or linking groups of participants advocating different viewpoints, especially when this is seen as a step towards appreciating their complementarity.
Distinguishing basic points
A conventional presentation of whatever kind contains basic points and associated comments. The various kinds of basic point can usually be briefly formulated in one sentence statements. The associated comments tend to require many sentences or paragraphs. The challenge is therefore to extract the basic points from a presentation and to display them in relation to those from other presentations or interventions. In Table 1 is given a structured list of the kinds of suggested basic points (or primary elements of inquiry or concern).
| Table 1 - Types of basic point (tentative) |
| I. Issues: Domain of inquiry or concern
II - Initial intellectual position : Basic statements about nature of domain of inquiry or concern
III - Preferred analytical approach ("Left brain") : Basic statements about appropriate process of inquiry or approach
IV - Preferred contextual approach ("right brain") : Basic statements about appropriate process of inquiry or approach
V - Explicable values and goals : Statements of underlying purposes and preferred outcomes of inquiry and approach
VI - Pre-logical preferences : Statements of temperamental preferences for acceptable end-states (e.g. with respect to the extreme positions of the following dimensions)
VII - Outcomes and conclusions: Statements about the resolution of the inquiry or concern
|
The list of items included under each heading is not necessarily complete, nor are the items necessarily mutually exclusive (i.e. there may be overlaps). The headings themselves are merely the result of a first effort to distinguish between different types of basic points. An effort has been made to respect the kinds of points which emerge in "rational" discussion as well as those which emerge in other (or broader) kinds of interaction. Clearly in a given case it may only be useful to extract a few of these points, or to regroup them into a small number of categories. Of course, other kinds of points could also be selected. The associated comments, or secondary elements of inquiry and concern, include the following :
- historial background and its interpretation
- prior research
- current facts and data
- explanatory comment, discussion, argument
- implications, elaborations, predictions
- discussion of alternative explanations or models
- definitions of terms, concepts, etc, formal deductive elaboration of theory, including derived propositions and hypotheses
- methodological considerations, operational statements
- advocacy, exhortations, anecdotes
- illustrative examples.
This proposal is not concerned with developing any new method of handling this type of information.
Relationships between basic points
Relationships are established or emerge between basic points either
(a) during the course of a conventional presentation. (b) in the discussion stimulated by it, or (c) as a result of group discussion initiated independently.
The challenge is to find a way of representing these relationships as a means of providing a contact within which the significance of any particular point can be seen in relation to the whole. In Table 2 relationships have been grouped under headings. As with Table 1, the grouping is only tentative and the list of relationships under each heading is not necessarily complete. It is surprising that research has not yet established a comprehensive typology of relationships, although partial typologies abound (2).
| Table 2 - Types of relationship between basic points (tentative)
| ||||||||||||
| A. Evaluative (positive) : Namely a positive evaluation of one basic point, which could be linked to another point in terms of which it is so evaluated
B. Evaluative (negative) : Namely a negative evaluation of one basic point, which could be linked to another point in terms of which it is evaluated
| C. Comparative (positive) : Namely a positive comparison between two basic points
D. Comparative (negative): Namely a negative comparison between two basic points
E. Comparative (logical) : Namely the standard logical relationships between two points
F. Comparative (structural)
| |||||||||||
Clearly in a given case it may only be useful to distinguish a few kinds of relationship, regrouping them into a smaller number of categories (e.g. agreement, disagreement). Alternatively, others could be added reflecting different kinds of linkage. Representing the basic points and relationships The display envisaged would consist of a large wall-space, e.g. 2 metres by 3 metres, or more (3). This could be :
- a conventional blackboard, in which case chalk markings would be used
- a cork-board, in which case the surface would be divided up by coloured thread or ribbon between pins, with wording on cards
- a plastic surface (whether hard or soft, roll-up, material), in which case marker pens would be used, possibly with wording on cards attached with tape
- a metallic surface, in which case the surface would be divided up by coloured thread or ribbon between magnetic markers (also used to attach cards). Clearly any such surface can be divided into areas and sub-areas. Attachable cards can be used to carry various kinds of information (e.g. the statement of a basic point) and may therefore be of different colour, shape or size. Card pins (or other forms of attachment) may be used to qualify information (e.g. evaluative comment, as in Table 2). Thread/ribbon (or marked lines) between cards may be used to denote various kinds of relationship according to colour or size. (A qualifying comment might be attached in the form of a small card, if necessary). Lists can be used to accumulate (e.g. on the outer perimeter of the display) information which would result in a clutter of unnecessary cards.
If desirable, cards may carry additional information like "originator of statement" (e.g. group, session, or participant name or number). Participant numbers could also be indicated on card pin heads, particularly for evaluative comments (see below).
| Horus A god of ancient Egypt and the son of Osiris and Isis. Often represented by an eye such as the detail above from a gold pectoral from the tomb of Tutankhamon. Symbolizes the need for an unifying overview, for vigilance, and for unrelenting acuity in the maintenance of a just equilibrium between adversaries in order to ensure the triumph of the forces of light. |
 |
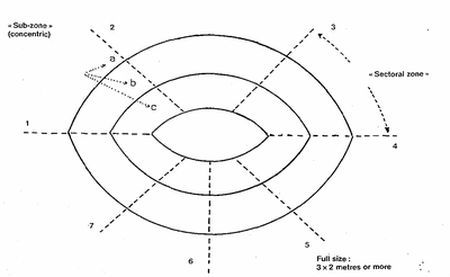 |
| Diagram 1 - Example of a useful display form |
This description deliberately avoids stressing a particular display formula since it is much better for the organizing group to adapt the possibilities to the scope and preoccupations of their own particular meeting (and/or to adjust the display in the light of usage). However, as a guide to the process of selection. Table 3 is provided. This matches the basic points and relationships against the display possibilities. It may be filled out in the light of particular requirements. (N.B. - This table is not the display, but a guide to designing one).
Table 3 - Display design : Matching wall-display options with meeting content
|
Display Options
Meeting content
|
|
Area options
|
Cards
|
Lists
|
Links
|
Card pins
|
||||||||
|
Ellipse/ circle
|
Rect./ square
|
Other
|
||||||||||||
|
a. con centric zones
|
b. sect oral zones
|
c. sect- oral subsones
|
a. zones
|
b. sub- zones
|
c. sub- zones
|
sphere
|
cone
|
other
|
colour shape other
|
colour shape size
|
colour width
|
colour size
|
||
|
|
Predefined topics
|
|
|
|
|
|
|
|
|
|
|
|
|
|
|
Basic Points (Table 1)
|
Emergent issues/ | subtopics Initial positions II Intellectual approach HI Contextual approach IV Explicit values V Prelogical preferences VI Outcomes/ conclusions VII Other (Integrate)
|
|
|
|
|
|
|
|
|
|
|
|
|
|
|
Rela tion ships (Table 2)
|
Evaluation (positive) A Evaluation (negative) B Comparison (positive) C Comparison (negative) D Comparison (logical) E Comparison (structural) F
|
|
|
|
|
|
|
|
|
|
|
|
|
|
N.B. - Mark appropriate positions in this table to aid in design of display. Only a few categories need be used; they may also be grouped (see Table 4, for example).
As a guide to further reflection about the possibilities, one interesting distribution of areas is presented in Diagram 1. A circular form is convenient because it allows interrelationship between concentric and sectoral zones; in addition the centre can be highlighted as a point of focus or integration. The ellipse is slightly more practical in that it is easier to read cards (with typescript) pinned high up on such a wall-display rather than a circular one (4). In Table 4 two possibilities for using the areas in Diagram 1 are given. Table 4 is a simplified form of Table 3. The differences between the two formulae illustrate the flexibility of the techni-que.
There are of course a variety of ways in which the display could be used in practice. Although not necessary, it is probably desirable that the display be prepared before the meeting on the basis of background capers or ideas.
- Changes to the display could be made after deliberation by a suitably motivated workgroup on the basis of the evolution of the meeting, and group or faction consensus on particular basic points.
- Changes to the display could be made on request by participants to the per-son(s) responsible for it (and standing by it). Participants could formulate basic points directly onto cards, or have them typed. Relationships could be inserted at their request. A record of such requests could possibly be kept, particularly if the originators of each change are not identified (or if some are entered for other participants).
- Changes could be made to the display by participants themselves with or without the guidance/assistance of a responsible person.
Clearly, the last approach makes the whole exercise much more participative, which may be highly desirable in certain meetings. On the other hand some thought should be given to protecting the display from casual or deliberate misuse. This is specially the case if use is made of the evaluative option (Table 2 : A or B as a vote). Some of the possibilities for this include :
- Evaluative indications could be made via a special workgroup (Procedure 1 above).
- Evaluative indications could be made by selected participants (e.g. those who have contributed to debates). The card pins could identify the participant by number. (This corresponds to Procedure 2. above). Alternatively, if many participants use this facility, their names could be transferred (if necessary) to a list on the edge of the display.
- Such indications could be made by any motivated participants (Procedure 3, above).
It is with the last approach that difficulties may arise, depending on the nature of the group and the capacity for self-restraint (in the absence of filters and gatekeepers). On the other hand, the openness is a considerable stimulus to a new form of participation which combines some of the advantages of voting and wall messages (5).
An appropriate choice must be made by the organizing group and modified in the light of on-the-spot experiences. It is important to note that a very simple form of the display may be used by grouping categories to correspond with the visual tolerance of participants
Table 4 : Examples of two formulate for the display form above (Diagram 1, p. 544)
|
Meeting content Design options |
Predefined |
Basic |
Relation- |
Relation- |
Card location in sub-zones |
||
|
Individual
|
Subgroup
|
Group
|
|||||
|
FORMULA 1
|
|
|
|
|
|
|
|
|
Sectoral zones
|
1-7
|
|
|
|
|
|
|
|
Concentric zones
|
|
|
|
|
a
|
b
|
|
|
Card colours
|
|
1-4
|
|
|
|
|
|
|
Ribbon colours
|
|
|
1
|
2
|
|
|
|
|
FORMULA II
|
|
|
|
|
|
|
|
|
Sectoral zones
|
|
1-7
|
|
|
|
|
|
|
Concentric zones
|
|
|
|
|
List
|
a-b
|
c
|
|
Card colours
|
1-5
|
|
|
|
|
|
|
|
Ribbon colours
|
|
|
1
|
2
|
|
|
|
N.B. - This is a simplified (and modified) version of Table 3 with options taken for the two cases. Switching the significance of the sectoral zones and card colours results in very different displays.
Further possibilities
1. In certain circumstances it may be worth using parallel or subsidiary displays, particularly where it is necessary to handle questions internat to some issue area.
2. In some cases it may be useful to relate such structural displays to displays of illustrative images (photos, etc.). Cards referring to locations on the image display could be inserted on the structural display at appropriate locations (and vice versa). Similar cards could be used to refer to film showings.
3. It would be useful to prepare standard roll-up displays (e.g. on a plastic surface) on which are faintly preprinted in some detail a complete range of basic points and relationships. Points made in the meeting would then be superimposed where relevant (6).
4. Displays, especially when pre-prin-ted, could give particular attention to time, from two completely different viewpoints :
- the dates between which a particular basic point or relationship was advocated, to show historical development. where relevant (namely phylogenetic development)
- the education/age levels between which a particular basic point or relationship is recognized, to show when new perspectives become appropriate (namely ontogenetic development).
5. If a display changes rapidly during a meeting, it can be periodically photographed as a visual record of the evolution of the meeting.
6. Special areas may be provided on the display :
- for basic points commenting on the display itself ("this whole approach is manipulative...", etc.) by those alienated by such a technique
- for integrating comments which set out to interlink the viewpoints emerging on the display (see below). In a circular display, this could be the central area, for example.
7. A circular or ellipse display may be used to emphasize any integration between perspectives. Positions closer to the centre may be used for more central points. Relationships of agreement (or compatibility) between such points may be used to "pull" them to positions closer to the centre, whereas those of disagreement may be used to - push -them out to the periphery. The pattern of agreement/disagreement (coloured ribbons) could provide a very graphic indication of the relative integration/fragmentation of the meeting (7). The development of this possibility could be very significant as a chart of meeting progress.
8.The relationship to such meeting procedures as Syncom could be explored, since the display could provide a visual record of what is occuring within and between the Syncom sub-groups.
9. With the increasing interest in computer conferencing and conferences linked via satellite (8), there are two further possibilities :
- displays may be maintained and used to provide a visual link between participant verbal contributions on particular points;
- computer conferencing software may be designed to relate typed contributions to positions on such a display, or possibly to generate update cards for insertion on maps at each terminal location.
10. The relationship of such a display to the computer-assisted production of participant group "mental models" could also be considered (9).
11. The relationship of such a display to the recording of the evolving relationships between factions or affinity groups (10) within a conference could also be considered. Such a display should facilitate such an evolution.
12. Especially when such a display is used in a small meeting room, there may be types of meeting in which participants can focus their comments in relation to the display (as with a blackboard). In the interplay between discussion and changes to the display, any evolution in the pattern of agreement/disagreement (11 ) can be visually supported to counteract tendencies to obscure integrative clarity when it has been achieved.
An alternative approach
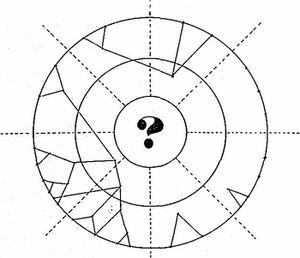
A somewhat different approach that merits investigation may be envisaged in the light of network presentations such as for CPM (Critical Path Method), PERT (Program Evaluation and Review Technique) and in citation analysis. In CPM and PERT networks a single node is indicated as the start point from which the network develops, with a single node as the end point to which the network converges. However as illustrated by Diagram 2, if many independent start points are allowed, they can be positioned around the circumference of a circle by sector (e.g. according to topic, as discussed above). Points derived from (or subsequent to) others on the circumference are positioned towards the centre. Further development leads to convergence of the network as a whole on the centre from its circumferential Origins. Unlike CPM and PERT, at any particular time the "end point" remains undefined and dependent upon further development of the encircling network (12).
The difference from the previous displays is clearly that new contributions which do not build on existing achievements are seen as (a) reinforcing those achievements, either usefully or unnecessarily, or (b) undermining them, as the case may be. Two contrasting possibilities, for
example, are to use the circumferential points to represent specific factual details or, alternatively, abstract general standpoints. In the first case convergence on the centre can be used to record progressively more abstract points. In the second, convergence records emergence of more concrete practical viewpoints (e.g. a specific action programme).
The concentric rings can in each case be used to denote points at different levels of abstraction. If an effort is made to juxtaposition associated topics (represented by sectors), then citation links to points in distant sectors (i.e. across the centre) are less frequent. If a new approach is recognized, an extra sector could be added.
This is therefore a method of ordering information which makes it evident which points need to be considered in order to move on to a new level of significance or synthesis. Variations of it could be developed to focus group discussion or policy debates.
| Diagram 2 - Convergent network display (an alternative approach) Initial, starting or fundamental points are positioned on the circumference in the sectors (according to topic). Points citing them, based on them, or derived from them are positioned more and more towards the centre - as the meeting progresses (and if it generates new insights). |
 |
References
1. I am indebted to David Horton Smith for extensive discussion or the contents of this section and the following one. He should not be held responsible for their present inadequacies2. de Grolier, Eric. A study of General Categories. Paris. Unesco. 1963.
3. In special cases it may be possible, or useful, to use a nonflat surface, such as a cone or a sphere, e.g. if it was desired to stress some integrative or wholistic lower the display to permit adequate access to the whole surface, particularly to read cards,
4. Horus, the name suggested for this wall-display approach, is derived from: Holistic Overview and Representation of Underlying Structure. The eye, an ellipse, is a symbol of the Egyptian god Horus.
5. Yona Friedman has advocated a form of this for conferences of the World Future Studies Federation. Another form is of course favoured in China.
6. Since many of the basic points have been established in many meetings, such a display should be available anyway to focus discussion.
7. The "eye" of Horus could appear very "bloodshot" as a consequence of the degree of disagreement in some meetings - if red ribbon is used!
8. For example the World Symposium on Humanity (April 1979) is scheduled to link, via satellite, meetings of 3,000 people in Los Angeles. Toronto and London. Both video and computer conferencing will be used.
Judge, Anthony. KnowIedge-representation in a computer-supported environment. International Classification, 4, 1977, 2, pp. 76-81.
9. Johnson-Lenz, Peter / Johnson-Lenz, Trudy. Conference facilitation by computer-aided sharing. Transnational Associations, 29, 1977, 10, pp. 440-445.
10. Judge, Anthony. Emergence of interactive processes in a self-reflective assembly. Transnational Associations, 30. 1978. 5. pp. 271-275.
11. Although hopefully more subtle patterns will become acceptable, based on complementarity between a diversity of "incompatible"perspectives. The agree ment/disagreement duality is crude in comparison.
12. The diagram could also be seen as representing a ringed tube or tunnel, with new segments appearing in the centre as one "advances" down it -- the old segments passing out of the field of vision. In some cases it may be useful to envisage the tunnel as looping back on itself in a circle (or even forming the throat of a torus). The sectoral dividers could also be envisaged as spiralling towards the centre.