Prepared in 1979 in connection with the Forms of Presentation sub-project of the Goals, Processes and Indicators of Development (GPID) project of the United Nations University. Printed in Transnational Associations, 1982, 2, pp 80-89
Introduction
This paper explores the possibility of a new approach to the representation of any complete ranges of human activity or concern. The justification for doing so has been discussed elsewhere (1, 2, 3). The intention is to provide a much improved overview of their degree of relationship and a feel for the dynamics between them. A particular concern is to reflect adequately the degree of lack of relationship, indifference, mutual irrelevance, or distortion of perspective characteristic between those active in such different fields.
The tentative nature of these investigations must be stressed. At this time it appears that three distinct approaches must be clarified. Then, by interrelating them and allowing each to modify the interpretations to which the others give rise, a basis for the new representation sought emerges.
The prime concern here is not one of logic or rigour since, to the extent that these have been called for, they have been utilized in more conventional responses to the problem (e.g. classification schemes, general system theories, world models, etc.). Rather the concern is to provide a convenient, comprehensible representation - capable of embodying all the detail and precision required - which will provoke reflexion, discussion at many levels, and feedback on the perceived relationships between the fields represented. The concern is to create a communication tool to fulfil a need not met by conventional explanations, information frameworks and systems. Given that the conventional approaches are unable to provoke their users into formulating better (as opposed to more precise) questions, the tool sought should enable users to formulate those questions for which they did not know that they needed the answers.
The three approaches are examined separately in Parts 1 to 3 below. In Part 4 their interrelationship is explored.
Part 1: Ordering distinctions
In this approach the point of departure is the concept of a complete range of human activity or concern, namely a totality which is divided up by making distinctions, whether in a series or nested. Aspects of this question have been explored elsewhere (1), especially the relationship of the act of distinguishing to cognition.
Two much used representations of such breakdowns are the list and the matrix:
List: A list does not order the relationships between its elements except in relation to nested sub-lists or in the case of a list in series form. This does not imply that such relationships are lacking, merely that they cannot be reflected in the list form. Note that a list is in fact a series of "points", but it is not necessary to conceive of it as such. The points could be represented as areas on a surface. It is only in the matrix that the manner in which the total area is cut up becomes explicit.
Matrix: The cells of a matrix may be thought of as sub-areas of the area representing the totality which the matrix attempts to reflect. The sub-areas are of course positioned with respect to column and row communalities. It is now interesting to ask why the area is bounded in such a limiting manner. For the rectangular/square form is one of the simplest. It provides a (paned) "window" through which the totality may be perceived. But it raises questions about the "wall" in which the window is set and the position of the observer in relation to the observed on the other side of the window.
Now to the extent that the matrix is complete in its coverage, there really should not be any "wall". The matrix should in such cases in effect "wrap around" the observer; all is window and nothing is implict, unexplicated or excluded. If this is not so then the wall should be conceived as wrapping around the observer, possibly with other windows corresponding to other partial views of the external totality to which the observer may turn his attention.
From this point of view the conventional two dimensional matrix raises the question of the conceptual significance of crossing the encompassing boundary. It is irrational and unmeaningful because the "wall" is unrecognized. There is almost a flavour of danger of "failing over the edge" as sailors feared with the early "flat earth" models (quaintly conceived in the East as supported on the back of a primordial elephant or tortoise).
If it is assumed that the matrix is complete, then it should be possible to represent it without such an arbitrary external boundary. If the external boundary is eliminated then the matrix takes the form of a closed surface (wrapped around the observer). By what procedure can a two-dimensional matrix be so modified and to what does it give rise ?
Consider a 2-by-2 matrix. The simplest symmetrical figure which retains the same number of areas is the tetrahedron. It provides four "windows" on the external universe for any observer positioned within.
The continuity of surface area of the three dimensional figure emphasizes any functional continuity between the aspects associated with the individual sub-areas or facets (the "panes"). But at the same time it drawn attention to the discontinuities between the areas associated with the edges. They are not smooth transitions but are marked by sharp angles. It may then be asked (if reality is continuous in contrast to our conceptions thereof) whether such a representation suggests others which would reflect a lesser degree of discontinuity between aspects. And indeed there are, for the greater the number of symmetrically disposed surface areas ("panes"), the larger the angle between adjacent areas and the closer the approximation to a continuous surface, namely a spheroid.
However, the greater the number of distinct areas (whatever they signify), the more difficult it is to comprehend the totality with any precision. The patterning of the surface area may be readily scanned but it is only through the "distorted discontinuities" of the most unspherical figures that it may be grasped to any degree.
A compromise may be considered however. Even a tetrahedron may be projected onto a circumscribed sphere. This cuts up the surface of the sphere into four (spherically) triangular areas. More complex figures would of course result in more complex patterns on the surface of the sphere. The challenge is of course to maintain continuity but the realities of the discontinuities between extant conceptual frameworks may suggest that any such goal is idealistic. Disturbing factors are:
(a) Unequal development: Clearly a particular cell of a matrix may itself be broken down into more sub-cells than is yet possible with its neighbours. such differences would be reflected in the surface patterning of the associated sphere. (The intermediate three-dimensional figure would of course be asymmetrical to a corresponding degree).
(b) Gaps: Assuming that the original ma-trix was incomplete to the extent of missing one row, for example, then its "presence" could be indicated by an appropriate number of (shaded) areas on the surface of the sphere - if their "absence" from the total pattern had been remarked of course.
(c) Zones: Assuming that originally there were two or more unrelated matrices which each encompassed aspects of the reality to which an observer could be sensitive, then their representation on the sphere surface would give rise to patterned non-contiguous zones separated by unmarked (shaded) areas reflecting the discontinuity between them. (The rules for projecting the plurality of intermediate three-dimensional figures onto the surface would be more complex than before). The manner in which these disturbing factors are handled indicates the freedom associated with this representational approach. Clearly distinct matrices could either give rise to distinct spheres or could be incorporated onto a single sphere as non-contiguous zones (case c). On the other hand, the possible articulation into many nested levels of a particular cell in a matrix (case a), could be handled by representing the latter on a separate sphere if the totality of its special perspective needed to be stressed. List elements, re-presented by areas (see above), could be disposed around the surface of a sphere on the basis of a projection of a three-di-mensional figure with the appropriate number of sides. If the list was not "complete" then gaps in the spherical surface would be required (case b).
Pattern of contiguity
In a matrix it is clear how the cells relate to one another. Once the boundary is eliminated, however, the question of what is contiguous to what is raised. Also in a two-dimensional matrix there are two types of contiguity (row and column) between cells. But, considering the simple example of a 2-by-2 matrix transformed into a tetrahedral surface, the validity of juxtaposing particular areas may be questioned.
(a) Enantiodromia: A strong objection that may be made to juxtaposing cells at opposite boundaries of a matrix is that they obviously reflect extreme poles of distinction. And yet there is much to suggest the intimate relation-ship of extremes (4). Whether it is the French phrase "les extremes se touchent", traditional Chinese concepts of the continuous transformation from yin into yang and vice versa, or the classical Greek dramatic notion of enantiodromia (T.S. Eliot, The Four Quartets: We shall not cease from exploration. And the end of all our exploring, will be to arrive where we started, And know the place for the first time), in all cases there is a functional continuity which the matrix form conceals. On the other hand the matrix itself may be missing rows and/or columns, in which case juxtaposition would be inappropriate.
(b) Valency: In a two-dimensional matrix, all cells have a valency of 4 (neglecting the boundary question discussed above). The better known three-dimensional closed figures may have surface elements of valency 3, 4, 5, 6, 8 and 10, although not all combinations are possible this implies a greater richness than can be adequately captured by a matrix, and a richness whose continuity is maintained in its projection onto a spherical surface.
(c) Linkage lines: In a two-dimensional matrix, the links between cells of the same row or column are clear. Such strings of areas may also be present on the three-dimensional closed figures, although partial strings are then also feasible.
(d) Matrix projection: Although it is acceptable to portray a map of the globe as a "matrix" of latitude/longitude cells, despite the distortion, a less distorted representation is achieved by using other projections which de-part from the rectilinear mode. These clarify to different degrees the time relationship between the areas as projected from the position of the observer. It is possible that representation of matrices could benefit from being seen in this light.
(e) Complementarity: In some matrices, complementary pairs of cells are evident. Such complementarity may be even more evident in the symmetry of three-dimensional closed figures, in relation to the points raised in Part 2.
Part 2: Complementary
The three-dimensional closed figures discussed in Part 1 are ideal abstractions in an important sense distinct from that al-ready mentioned. It is a fact that all but the simplest structures (not excluding the cube, for example) are not of themselves stable. If the vertices play no structurally stabilising role they collapse. Intuitively this suggests the importance of attention to design techniques which could ensure the inherent stability of structures con-forming to such patterns.
These problems have been extensively investigated by Buckminster Fuller and others. Their relevance to the concerns of this paper have been discussed else-where (5, 6, 7).
Of special relevance is the concept of counterbalancing counteracting forces as a basis for maintaining the pattern in question. This is achieved through tensegrity structures. It suggests that complementary opposed factors should be specially positioned in relation to one an-other. This pattern of constraints may be used to design a spherically symmetrical representation (5).
Part 3: Comprehensible code
In this approach the concern is to make use of some surface which can be suitably "coded" to provide "hooks" onto which concepts can be "hung" in such a way as to facilitate comprehension of the patterns as a whole. The emphasis is therefore on providing a trigger for memory and comprehension. This preoccupation has a long history going back to the Greeks, and possibly the Egyptians, as reported by Francis Yates (8). It is only comparatively recently in the 17th century that it went out of favour with the western scientific revolution and the widespread use of pa-per as a crutch for memory. There is little current concern with memory (particularly with the increasing number of information services and references tools) other than in the form of gimmicks to meet the challenge of examination, or in relation to speed reading etc. On the other hand these gimmicks, current investigations of memory prodigies, and the reports of the ancient art, all emphasize the importance of suitable "hooks". The relation to comprehension, as exemplified by the Eastern practice of the mandala (9), is discussed elsewhere ( 1 ).
A recent paper proposes the use of a spherical surface to model the body of knowledge and its development (10). The concern did not extend to problems of comprehension. As Yates reports, this demands the use of "hooks" which usefully trigger the imagination through non-intellectual processes, however irrational and unsystematic they may appear. Thus favoured "surfaces" included building complexes which enabled some to use over 120,000 memory locations in a structured comprehensible relationship to one another. The production of a suitable representation can be seen as a problem of design, namely a series of decisions about the relationship between form and content (11). This involves a struggle for a "best fit". As the design is "firmed up" to completion, its value as a tool for improved comprehension becomes increasingly apparent.
As a design problem, any initial attempts are bound to contain many weaknesses. These could however be progressively reduced following experience with the representation, discussion and feedback. Part of the merit of this approach (for some at least) lies in reflecting on the design problem itself and the disciplined pattern of decisions which need to be made. It is likely that there are several alternative patterns which could lead to equally useful and thought provoking results.
Decision 1: The surface used for the representation shall be a spherical one. This has the merit of built-in continuity which, through the absence of a boundary, does not give undue privilege to any position on the surface. Being finite and rounded it has a certain "graspable" quality; the form of the whole is intuitively comprehensible as a gestalt. This quality is absent from conventional tabular (or matrix) presentation which provide an abstract framework lacking any focus for comprehension. The same is true of more complex surfaces (although there are merits to the use of a torus, for example).
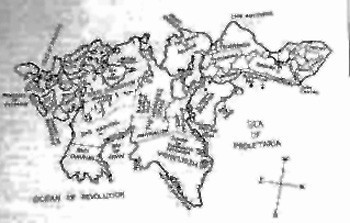
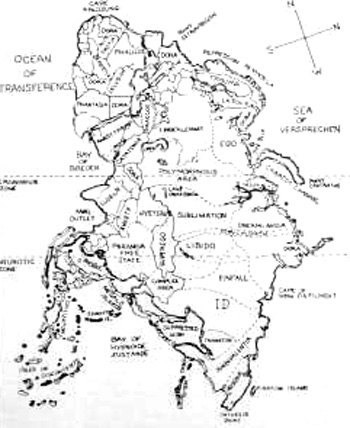
Decision 2: The surface shall be broken up into a pattern of two interweaving forms: "land" and "water". Clearly a uniform surface would not provide any "grip" for the imagination. Simply inscribing a regular latitude/longitude grid pattern would also stress the abstract and alienate the imagination. The land-and-water coding appeals to the imagination because of the widespread familiarity with the terrestrial globe, its various surface features, and their relationship to the observers own location and those of others of whom he is aware. It has an organic quality which is encountered in fictional fantasy worlds (of Tolkien), science fiction, or humour (see Fig. 1 and 2; are they conceived as continents on a "flat earth", and if so, why ?; how distant are they from each other ?).
Figs. 1 and 2 Humorous mapping exercises.
Reproduced from : Rebus Heaviwait and Emmanuel Lighthanger. Projex. Links Books, 1972.
(pseudonyms for John McHale and Magda McHale, respectively)Fig. 1: Marxyland Fig. 2: Anotherland Decision 3: The two-fold distinction on the surface shall be used to carry the basic two-fold distinction in human activity and concerns. Here care is required because of the problems of label words at this level of abstraction (1). It is not a question of adequate definition, because this simply introduces the vicious circle of the definition of the words used in any definition, etc. ignoring the question of comprehension. The words used here are therefore to be considered as pointers only. The basic distinction is between what can be comprehended (by the reader/observer) as common to what is denoted by the labels in earth of the following lists:
- "land": rational, intellectual, conscious, order, recognized "left brain", yang, practical, expressed, etc
- "water": irrational, emotional, unconscious, disorder, unrecognized, "right brain", yin, "impractical", repressed, etc
This is not in any way meant to suggest that one is `` better" than the other, just as it would be ridiculous to suggest that land is better than water.
Decision 4: The land masses shall represent activity performance rather than the activity as a subject eg performing chemical operation and associated symbol manipulation, rather than "chemistry" as a body of knowledge; praying rather than prayer; etc. This removes the need to consider subjects which are not associated with a pattern of activity, and renders other subjects subordinate to the pattern of activity with which they are associated. It is a move from a noun-focus to a verb-focus (and is thus more process oriented). Subsequent investigation may suggest that this decision should focus more on the notion of the "body of knowledge" rather than "activity performance". Revision of the design sequence would then be required or the advantages of an alternative design considered. It is possible that some mixed notion ("disciplined order" ?) would be preferable whose specification might itself raise problems of labelling, definition and comprehension.
Fig. 3: ICC - Information coding classification
Reproduced from : I. Dahlberg, International Classification. 9 (1982), 2, p.87-93.AREAS
1
2
3
4
5
6
7
8
9
1
FORM &
STRUCTURE. AREA
11
Logic
12
Mathematics
13
Statistics
14
Systemology
15
Organization
16
Metrology
17
Cybernetics (Contr. and automat.)
18
Standardization
19
Testing &
monitoring
2
ENERGY and MATTER
AREA
21
Mechanics
22
Physics of
matter
23
Gen. and tech.
physics
24
Electro-
nics
25
Physical
chemistry
26
Pure
chemistry
27
Chemical
technol. &
engg.
28
Energy
sci. &
technol.
29
Electrical eng.
3
COSMO &
GEO-AREA
31
Astronomy
& astro-
physics
32
Astronau-
tics and space
research
33
Basic geo-
sciences
34
Atmospher
sci. and tech.
35
Hydrospher.
& oceanol.
sci. and tech.
36
Geological
sciences
37
Minig
38
Materials
sci. and me-
tallurgy
39
Geography
4
BIO-AREA
41
Basic
biol. scien-
ces
42
Microbio-
logy and
cultivation
43
Plant
biology and
cultivation
44
Animal
biology &
breeding
45
Veterinary
sciences
46
Agriculture
& horticul-
ture
47
Forestry &
wood sci. &
technol.
48
Food
science &
technol.
49
Ecology
& envi-
ronment
5
HUMAN AREA
51
Human biology
52
Health &
theoretical
medicine
53
Pathology
& medi-
cine
54
Clinical
medicine &
cure
55
Psychology
56
Education
57
Profession,
labor,
leisure
58
Sports
59
Household
& home-
life
6
SOCIO-
AREA
61
Sociology
62
State and politics
63
Public
admini-
stration
64
Money &
finances
65
Social aid,
social poli-
tics
66
Law
67
Area plan-
ning, urba-
nism
68
Military
sci. and tech.
69
History
7
ECONOMICS and TECHNO-
LOGY AREA
71
Gen. and natl.
economics
72
Business
economics
73
Technology
in general
74
Mechanical
& precision
engg.
75
Building
76
Commodi-
ty sci. and
technol.
77
Vehicle sci.
& technol.
78
Transport.
technol. &
services
79
Utilities
& service
econom.
8
SCIENCE and INFORMA-TION AREA
81
Science of
science
82
Information
sciences
83
Informatics,
computer
sci.
84
Information
in general
85
Communi-
cation sci.
86
Mass-com-
munication
87
Printing &
publishing
88
Communica-
tion engg.
89
Semiotics
9
CULTURE
AREA
91
Language
& linqui-
stics
92
Literature
& philology
93
Music
& musico-
logy
94
Fine arts
95
Performing
arts
96
Culture
sci.i.n.s.
97
Philosophy
98
Religion
& secret teachings
99
Christian
Religion
The "fields of human activity" denoted by the land masses could be interpreted to include: walking, hating, philosophy, economics, welding, chemistry, drama, meditation, etc. They could have been restricted to intellectual disciplines (12), or more broadly to occupations (13). They could have been extend to types of role. Only by further investigation will the implications of this design decision become apparent.
There is an obvious design problem of determining which level of " human activity" is to be mapped by the surface areas themselves and which levels could be more appropriately indicated by (a) features on those areas, whether "natural" or "artificial", or (b) by "natural" or other activities occurring on or over such surfaces, or (c) by making use of one or more other spherical surfaces (a point raised in Part 1). This question will be considered in Part 4
Decision 5: It follows from Decisions 3 and 4, that the water masses shall be used to represent human activity which is not "consciously" and "rationally" ordered in the manner associated with land masses. A land mass split by a body of water, would thus be used to represent an "irrational" discontinuity in an ordered approach. The distinctions implied by the size and nature pf the body of water (ocean, inland sea, lake, river, marsh, stream, etc) will need to be clarified by subsequent design decisions even if their possibilities can be intuited at this point.
Two basic design problems must be faced at this point namely:
- the determination of the relative size of any land mass or body of water, even if attention is restricted to surface area.
- the disposition of the land or water areas in relation to one another; the pattern they constitute on the surface of the sphere.
At this point it is necessary to draw together the threads emerging from the three approaches and to return to insights from Parts 1 and 2.
Part 4: Integration
The conceptual procedure whereby a matrix is formulated gives rise to cells of 'equal importance' or 'weight'. By this is meant that each category (cell) is equally distinct from the other categories (cells). Of course, if some quantitative measure is attached to the cells than there will be inequalities. But these may be considered secondary (at least for the moment).
Using the argument of Part 1, the matrix categories may be given equal 'land' areas (in Part 3) on the surface of a sphere, at least as a first approximation. If the matrix attempted to reflect all fields of human activity (see Fig. 3, for example), then this could be considered an indication of the desired subdivision of the spherical surface. The relationship of the matrix cells might also be considered an adequate indication of the disposition of the areas on the surface.
This procedure of course presupposes that :
(a) the matrix is complete,
(b) all activity is rationally ordered
(c) the relationships between such activities are rationally ordered.
The current lack of relationships between the natural sciences, or with the social sciences, the humanities, or other modes of activity shows the weakness of this presupposition and the difficulty which would be encountered in formulating such a matrix. Even classification science, by definition neutral to the variety of fields of activity, generates a variety of competing matrices (although they are usually lists). In fact Fig. 3 constitutes the most recent effort to cover the complete range with a minimum of distortion. But of course it is not designed to highlight the hiatus, in the minds of the practitioners, between the different fields. One may also ask what aspects of human activity are omitted from a " subject field" matrix with its built in emphasis on the study mode.
In the light of Part 3 therefore, "water" areas are likely to be evident along the discontinuities between the areas on the spherical surface. However this does not imply a regular pattern of "canals", for the degree of hiatus will vary between different "land" areas, giving rise to anything in width between a river and an ocean. On the other hand, some possible lines of hiatus will be eliminated as a result of the rational binding together of two areas (e.g. where a suitable paradigm ensures the appropriate meshing). Furthermore, a large category (e.g. a particular science) may be fragmented by a "network of waterways" into sub-areas due to the mutual hostility between its constituent schools of thought.
The question is then does the Part 1 procedure suggest a means of decomposing the surface further to delineate where discontinuities may arise between sub-categories. There is in fact a well-developed technique for doing so. This is the geodesic subdivision of the surface of a sphere (Fig. 4). It may be used to decompose the surface as finely as is required by the (ability to "resolve conceptually") the presence of nested sub-categories in a given zone (and not necessarily in another). It may be based on many of the three-dimensional figures to which the Part 1 procedure gives rise.
These steps indicate that it is possible to depart from the "simplistic" ideal subdivision of the spherical surface and to respond to local variations. But the areas so delineated, however small, are still bounded by "straight" lines (i.e. on the curved surface). It is a valuable indication (preserving the classificatory precision of Part 1) but lacks the organic quality sought in Part 3.
However, consider the ideal boundaries of the areas decomposed as in Fig. 5. If a given boundary is "eroded" by the encroachment of some irrational element. this may be indicated by selective removal of the smallest sub-areas, thus resulting in a ragged, "realistic coastline". This raises the question of how to determine with precision which such areas to switch from land to water.
On the other hand, the encroachment may be that of a neighbouring field of activity which "incorporates" a sub-area across the original boundary into its own domain. This opens the possibility to the indication of a ("political") switch of allegiance or empire building, neither of which is foreign to the dynamics between disciplines, for example.
Despite these possibilities however some nagging questions remain. They may be illustrated by imagining that in the absence of the conventional global map information was nevertheless available on all the land masses. This could be presented in list or matrix form. Despite the lack of any global perspective, inhabitants of the land masses could be consulted on their relationships with neighbouring territories and the barrier constituted by any intervening body of water. The problem is how to solve the question of scale, distance and direction on the basis of such interviews. How can any group associated with a particular pattern of activity be objective about the relative size of the land surface by which the activity is denoted ? There would be an obvious tendency to inflate the importance of that with which one was familiar and, unless menaced by it, to diminish that of which one disapproved or was misinformed (even to the point of declaring its existence to be a 'pure fantasy of fevered minds"). In this light, any map in likely to be the subject of considerable controversy (if in fact the procedure is held to be of any merit).
It may in future be possible to respond to this difficulty and provide a rational basis for positioning the boundaries between fields of activity and this is considered in Part 5. At this point some available indicators may be considered as a guide to refining a map in terms of size of surface areas as a measure of relative importance.
A number of possible indicators are available:
But, however these might be used to obtain some first approximation to relative importance, they fail to detect the more prevalent types of activity e.g. walking, cafe activity, love-making, etc. These are better recorded by time-budget data where available. However time-budget categories would prove inadequate to the task of distinguishing the variety of human activities which emerge from the data above.
- occupational statistics
- educational statistics by discipline or occupation
- funds associated with sectors of economic activity
- documents associated with particular "subjects" or disciplines.
Both types of data would fail to distinguish between the various patterns of activity often associated with different kinds of social grouping (e.g. organizations) or cultural group (e.g. communities). Clearly a variety of sources would have to be used to obtain a rough indication of surface areas as a stimulus to feedback.
A second question concerns overlapping patterns of activity (e.g. an occupation which involves walking, which is itself also a leisure activity). Here the overriding or determining pattern must be considered to take precedence.
This however brings up a further question. If the relative land surface approximations are based on some indicator like world man-hours per year per activity, some very basic activities might acquire undesirable prominence on the total surface (e.g. sleeping, food consumption, etc.). One approach, if desired, is to use a logarithmic relationship between man-hours and surface area. But would this destroy the desirable iconic value of such a map ? With regard to the degree of relationship between land areas, it should be possible to make some use of citation analysis. Clearly the frequency of citation of papers in neighbouring fields would be high. A frequency analysis could then lead to a suitable pattern of juxtaposition of fields. Of course citation information is only available for certain fields of activity and covers only a few publications, but it could nevertheless provide some valuable ("quantifiable") guidance particularly for the natural and social sciences. Possibly an analogous "citation" approach could be developed on the basis of a rigorous interview technique in order to cover other fields.
The preceding paragraphs are an indication of design problems to be confronted in the light of different kinds of information available. It is appropriate to view this problem in terms of the probable confusion in the minds of the early cartographers confronted on the one hand with religious and philosophic (ideal) models of the structure of the world, and on the other with a jumble of facts, opinions and rumours based on travellers and investigators with different kinds of axe to grind.
Doris Lessing: Briefing for a Descent into Hell
The world was spinning like the most delicately tinted of bubbles, all light It was the mind of humanity that I saw, but this was not at all to be separated from the animal mind which married and fused with it everywhere. Nor was it a question of higher or lower... I watched a pulsing swirl of all being, continually changing, moving, dancing, a controlled impelled dance, held within its limits by its nature, and part of this necessity was the locking together of the inner pattern in light with me other world of stone, leaf, flesh and ordinary light.. And on this map or plan that showed how myriads of ridiculously self-important identities were reduced to a few, was another, different, but, in some places, matching pattern, of a stronger, rarer light (or sound) that varied and pulsed and changed like the rest but connected direct, made a link and a bridge, a feeding channel, between the outer (or inner, according to how one looked at it) web of thought or feeling, the pulsating bubble of subtle surrounding colour, and the solid earthy watery globe of Man. Not only a link or a bridge merely, since this strand of humanity was open like so many vessels open to the rain, but part of the shimmering web of fluid joyful being, which was why the scurrying, hurrying, scrabbling, fighting, restless, having, wanting little patches of humanity, the crusts of lichen or fungi growing here and mere on the globe, the sea's children, were, in spite of their distance from the outer shimmering web, nevertheless linked with it always, since at every moment the glittering tension of singing light flooded into them, into the earthy globe, beating on its own delicious pulse of joy and creation.
Part 5: Transformations
This investigation has so far clarified a number of aspects of the design problem. Attempts at producing crude maps could be made. But it is possible that, by plunging further into the implications of the spherical framework, some useful insights and clues may be obtained to improve map design. That is the aim of this Part, which raises questions without necessarily supplying adequate answers.
Given the distinct land masses of Part 4, one may ask what "spreads" or "stretches" any such field of activity over the spherical surface to its boundary. Why is "mathematics" in one part and "art" in another ?
Suppose that each such field could be defined in terms of different combinations of a limited number of distinct "elements" of perception or cognition. Then how many elements are required at a minimum to enable the complete range of activity fields to be specified ? What kinds of elements and combinations are we talking about ? And how does this relate to the geometry of the sphere?
It is important to note that in denoting a field of activity by an area, this opens up possibilities which are absent when it is defined as a point -- as in a list, a classification scheme, or even a matrix (where a "cell" is in effect a point in an array). Such a field may be conceived as composed of points with a common characteristic. But towards any boundary of the field the "strain" increases on the specifications of the point in terms of the common characteristic (exemplified by the more central points of that field). The boundary is the location where the points shift allegiance to minimize the strain.
This suggests that the land mass denotation of field of activity reflects very adequately the crudity and rigidity of conventional conception of such activities. It corresponds to the Aristotelian either/or approach. The possibility that there might be some functional continuity across such boundaries is excluded. Attempts can made to extend the boundary of a field to encompass a neighbouring field, but the possibility that the nature of the field changes as one moves over it is excluded. Although in fact, as with border cultures anywhere, the activities on each side of the border may have more in common than with their respective central positions. This of course makes a matrix representation crude and unsubtle Also information must be placed in either one cell or another, but not between.
Expressed in term of the sphere, it would be much better to be able to indicate the type of activity by some function of the position of a point on the sphere. Transition from point to point would then give functional continuity emphasising continuous " transformation" from one activity to another. The "artificial" regrouping of points into areas to which a conventional label is attached, and the emergence of discontinuities between areas, would then be understood as arising from an inability to handle such functional continuity - an inability with which we are obliged to live. (There is a temptation to think of such artificial areal rigidifications as conceptual "tectonic plates" floating slowly around on an underlying semi-fluid continuous magma which wells up at the discontinuities... or as "macrons" (14)).
If this line is followed further, it may be asked how points might be defined in these terms. What function or coordinate scheme could be used to "spread", the complete range of activity "elements" over the spherical surface ? Is it, for example, possible to use any 4-fold scheme (e.g. Jung, Parsons, etc) such that from a given point moving "north", "south", "east", or "west" moves one to activities with a greater amount of "quality A", "B", "C" or "D" respectively ?
Clearly it would be important to avoid being trapped by any particular 4-fold scheme which effectively stresses the qualities characteristic of the field of activity within which it was formulated. Rather the principle of a 4-fold scheme would be accepted and the challenge of determining what content emerges from a 4-fold cut could be faced. This problem is discussed elsewhere (1). Basically the difficulty is one of avoiding the labelling tendency, the assumptions associated with labelling, the tendency to premature conceptual closure, and the problem of comprehension. From this emerges the possibility of taking whatever can be comprehended (without labelling) by the reader/observer as common to a wide range of 4-fold cuts. This is uncomfortable because of the elusive quality such as is found in the significance attached by Chinese philosophical texts to "north", "south", "east", and "west" (16) (Note that, even more than in the West, the Chinese emphasize the arreal as well as the directional character. This suggests a transformation from the "compass" circle representation to the spherical arcal which would create zones such as "north west", "south south east" to whatever level of detail was required. How they would be located as areas on the sphere remains to be explored. On the other hand labels may be attached for convenience, although the challenge to comprehension should be stressed whenever possible.
The geometry of a sphere also suggests a more elegant scheme namely in terms of radial coordinates. This effectivity transforms "north / south" and "east / west" into two angular measures. The challenge to comprehension of enantiodromia (see above) has of course to be faced. The relationship between angle and meaning has been explored by several authors (17, 18, 19) but the conclusions are at best tentative; much remains to be done.
It should not however be forgotten that the purpose of this exercise is to obtain an adequate `` conceptual surface". The sphere has comprehensible characteristics but by choosing it, it is immediately necessary to allow more complex phenomena (which are distorted by a spheric representation) to be projected onto it. The consequence is a necessary loss of (simplistic) neatness, emphasizing the value of the "realistic organic" map of Part 3. But the line of investigation can be extended further (without losing the link back to Part 3 and 4) by confronting the problem of different levels of abstraction and comprehension. It remains a design decision as to the level of abstraction at which the "fields of activity" are conceived and allowed to "impact" on the surface of the sphere. But what happens to the levels which are less abstract or more abstract, once such a decision is made ? Where do they get "put" ? Those which are less abstract may perhaps be allowed to "affect" the topography and geography of the sphere, and such design possibilities are briefly discussed in Part 6. Those which are more abstract and less comprehensible may possibly be projected into the socio-cultural life which could be designed onto the sphere. This approach is not considered further in this paper. Although it could be very meaningful as a communication tool and provides a rationale for the tendency to use cartoon, fictional and legendary characters to illustrate psycho-social dynamics. An alternative is to nest a number of other spheres concentrically within that already discussed, according to the number of levels of abstraction it is desired to represent. With this approach, the most abstract (i.e. most central) sphere would reflect a minimum number of distinctions whose relationships would be relatively clear and simple, but whose content would constitute a challenge to comprehension and would be impossible to define or label satisfactorily (1). At other levels, comprehension and labelling would be less of a challenge but the relationship pattern would be increasingly complex and difficult to define or to comprehend as a totality. Consider the successive shells of the I Ching elements with 2, 4, 8, 16, 32 and 64 components (16). The patterning of the latter is very complex, in fact one is reminded of the Chladni standing wave interference patterns (20).
If any more abstract spherical shells were omitted, their content and its relationships would have to be projected onto whatever less abstract shells were retained in the representation, or be left as "uncaptured" by it. Such projections would of course tend to complexity the patterning. Note that some clues to comprehending the nature of such a representation may be obtained by reflexion on the successive electron shells of atoms and the patterning of "orbital clouds". This is an impressive conceptual model of the relationships between successive levels of distinction. It is possible to see how many levels are required before N distinctions have been effectively made, namely how many levels are required before N distinct concepts can be effectively represented (1). The representation/comprehension problem of this shell approach has, interestingly enough, been confronted in the problem of representing the complete range of colours. Not only does Johannes Itten (21) suggest that the complete range can be represented by points throughout a sphere (defined by latitude and longitude), but he chooses to consider the basic colours as regrouped into 62 zones on the surface of the sphere (5 x 12, plus 2 Polar zones of black and white). He also chooses to consider the remaining colours as grouped in 3 inner shells. The whole scheme is structured so that complementary and contrasting colours are immediately evident. He also indicates the complexity and richness arising from colour "chords" of 2, 3, 4 or 6 tones based on the apexes of (three-dimensional) figures inscribed within the colour sphere (cf. Part 1). It is interesting that the representation of the range of colours is not yet understood or accepted, and that the analogous problem for sounds, odours, tastes and textures in far from being solved.
Whilst the shell approach was, ironically, much favoured by traditional religious philosophers (whether concerned with the structure of the cosmos or of man) and does have iconic merit due to its spheric symmetry, it nevertheless poses serious problems to comprehension. The same information can be represented by "deconcentricating" the shells and treating each as a planet in orbit around a central sun (presumably not a binary star!). The approach of Part 3 and 4 can then be applied to each independently in terms of the content of the level of abstraction decided. The structural richness of the solar system model, with which there is increasingly widespread familiarity, provides conceptual "hooks" on which to hang even more of the dynamics it is desired to capture in a representation. Clearly the planets must move in orbit, they must spin, etc. These stabilizing characteristics, which have traditionally constituted severe obstacles to comprehension, are even more difficult to comprehend in the shell model (electron "spin", etc.). They also raise interesting questions about the adequacy of a simple spherical representation without "spin" (implying "poles", "diurnality" etc.) or "revolution" (implying "seasons") around a central predominating "function". Clearly it is not adequate simply to use separate and unrelated spherical models to represent different sets of functions at different levels of abstraction (as is the conventional approach of disciplines concerned with different levels of abstraction). There is a responsibility (whose ?) to show their relationship by some means. The solar system model is structurally rich (Even greater richness can of course be obtained by using a .. galaxy ~ structure as a basis for a representation. as discussed elsewhere (22)) and, ironically again, has been used traditionally to relate different functions (e.g. gods, qualities and planets) to facilitate comprehension by the populace.
Hopefully it is now clearer how the design problems might be compartmentalized and structured. The design objective is to provide a representation within which one could structure one's thinking according to the level of abstraction at which one wished to function. This would not prevent, but rather encourage, consideration of the perspective at other levels of abstraction as appropriate.
Part 6: Mapping kit
It is to be hoped that Parts 3, 4 and 5 have given a better understanding of how "conceptual markers" might be used within some "terrestrial" or "solar" representation. It should be apparent that a step by step design approach is possible with many options. Many of the options can be designed into the representation without necessarily asserting themselves aggressively on the attention of the observer/user - who may be as sensitive or insensitive to the variety and complexity as are people with regard to their ordinary environment.
The stage is therefore set for the design team to create a world in which the familiar elements used in the representation are interrelated in a manner which reflects, as much as possible, what is understood of the relationships and characteristics of the psycho-social phenomena they denote. The design team may put into the design "kit", for use as "conceptual markers" as many features of the "real world" as are considered useful in carrying an understanding of what needs to be represented. The design challenge is to "feel out" the iconicity of different design options. A major difficulty is to resolve problems of level of abstraction and to determine where to ¢< put,. certain phenomena (e.g. as a geological, climatic, or social feature, or on a separate planet). A "poor" design would have the doubtful value of a literary metaphor. A "good" design would be highly isomorphic and would raise interesting questions. How isomorphic and how iconic it is possible to be remains to be discovered. The design problem is as much art as it is science, and that is how it should be to result in a significant representation (for the absence of either leaves us where we now stand).
It is interesting to reflect on how many distinctions and relationships are built into any conventional concept of the world and our labelling of its elements and processes (on the basis of education or experience). Of course part of the design problem here is matched in the different concepts of the world held in nonwestern cultures and languages. This does not prevent communication, however much it is distorted, but it disguises heavily the subtle differences in understanding (1).
In Fig. 6 some indication is given of the variety of features which could be considered in the design. It is worth bearing in mind the procedures used to interrelate objectively such features in the "real world" (e.g. topography and triangulation surveying). The stages and processes by which such techniques were discovered, and to consider the extent to which analogous problems are not to be faced in designing or understanding the representation.
Fig. 6: Metaphoric mapping features Continent, wind, mountain (chain), storm, peninsula, flood (plain), island, desert, watershed, swamp, valley, jungle, plateau, grassland, ocean, forest, strait, sea, estuary, river Part 7: Practical possibilities
Their have been a number of experiments which can be considered in the direction of producing "conceptual maps". A basic distinction must be drawn between those which are point-oriented and those which are area-oriented. In the point-oriented case, one may cite arrow-diagram experiments in classification (23). A similar technique has been used to produce metabolic/biochemical pathway charts (24). More generally there is the production of systems (flow) diagrams of various kinds (25). The limitations of this approach are apparent from the visual drabness of the basic flow chart of the Club of Rome sponsored, highly, significant Limits to Growth project (26). Equally "academic" are social network diagrams, although these usually show people linkages. Related to these, but focused on concepts are belief networks (27) and "mental models" (28).
A very crude and partial move towards an area-oriented presentation has been made in the UNESCO science policy information thesaurus, SPINES (29). This is really a compromise between the point and area forms as are the Venn diagram type figures used innovatively for international organization memberships by UNCTAD. Of a very different kind are so-called "mental maps" (31) of peoples perceived distortion of geographical areas with which they are (un)familiar. Other examples may be found (25).
Mapping Paradoxes
The map gives rise to two important paradoxes
(Reproduced from: P. Hughes and G. Brecht. Vicious Circles and Infinity; an anthology of paradoxes. Penguin, 1978).
from Lewis Carroll's Sylvie and Brumo Concluded 1893
posed by Josiah Royce, in The World and the Individual, 1899'That's another thing we've learned from vour Nation.' said Mein Herr. "map-making"
But we've carried it much further than you.
What do you consider the largest map that would be really useful ?'
'About six inches to the mile.'
'Only six inches!' exclaimed Mein Herr.
'We very soon got to six yards to the mile.
Then we tried a hundred yards to the mile.
And then came the grandest idea of all!
We actually made a map of the country, on the scale of a mile to the mile!'
'Have vou used it much ?' I enquired.
'It has never been spread out, yet.' said Mein Herr: 'the farmers objected: they said it would cover the whole country, and shut out the sunlight! So we now use the country itself, as its own map, and I assure you it does nearly as well.'
'Let us imagine that a portion of the soil of England has been levelled off perfectly and that on it a cartographer traces a map of England. The job is perfect; there is no detail of the soil of England, no matter how minute, that is not registered on the map; everything has there its correspondence.
This map, in such a case, should contain a map of the map, which should contain a map of the map of the map, and so on to infinity.'
Much more ambitious possibilities are foreseen (and are technically feasible with available hard ware) using computerized graphic devices and colour display screens. Douglas Engelbart envisages people using such devices to "drive around" each others conceptual spaces (32). It has been suggested that the multitude of data elements describing the condition of a highly complex industrial process might be represented to the controller in the form of a flower or a landscape, such that any change in a process condition would be immediately recognizable as alterations in the colour or shape of the elements depicted. Displays are already used to provide realistic visual representations of complex 3-D movements of 3-D objects (e.g. plane mancauvers) generated by computer, and this is far beyond the cruder 2-D versions already widely available as inexpensive home-TV games.Clearly there is little to prevent the "design" (in the sense of this paper) of animated representations based on geographical or even socio-cultural systems. Initially it would only be necessary to use the computer power to "explore" the topography in detail. Later "climate", "erosion", "plant species In "animal species Is can be added in together with their interrelationships. The possibility of growth, or geological or species evolution (from a "primeval" condition) could be explored. It is clear that, in contrast with conventional simulations, the dynamics of the representation impose a powerful and necessary design constraint which facilitates `` right brain" comprehension by non-specialists. The computerized display in fact constitutes a powerful design tool beyond its current uses for "computer aided design" of physical systems.
The problem is not so much the hardware but rather the information on the fields of human activity. This currently has built in blindspots or distortions due to the focus and interest of the investigating disciplines. Currently an attempt is being made to remedy this with a view to such a mapping exercise. This is being done with data on 8,000 "international" organizations covering the complete spectrum of human activities which have achieved international significance. This is obtained from the Yearbook of International Organizations (34), itself derived from a data base in common with the Yearbook of World Problems and Human Potential which was conceived with such a mapping exercise in mind (3).
Much can of course be learnt from the conventional discipline of map design (35) and from structures in nature (36).
Part 8: Evolving design
This unconventional approach to classification should be compared with the long series of approaches in the past (37, 38, 39). The record of how societies have chosen to see the universe/environment decomposed into categories is extremely instructive. E I Samurin examines over 200 such attempts (37).
As is to be expected no classification exercise bears a very happy relationship to any of its predecessors or contemporaries. The new rejects the old and views its inadequacies with considerable disdain. This attitude, tempered with defensiveness, also tends to characterize the relationship between advocates of the different schemes today - which are the basis of the computerized information systems of international agencies competing for financial resources.
What is missing is a sense of continuity not as a form of historical lip-service - but of the evolution of classification patterns. Now the design approach advocated in this paper provides such a linkage. For, if the exercise were to be conducted in terms of the framework of any given period of the past, it would be seen how the "land masses" would be differently located with respect to one another. The geological evolution of the earth may therefore be used to suggest the basis for a series of maps which record successive conceptual decompositions from "primitive" to complex. Continuity is respected.
... Against other people's maps
(Reproduced from: Russell Hoban. The Lion of Boaz-Jachin and Jachin-Boaz. London, Picador, 1974 p.121)."... Boaz-Jachin doubted that his father's map would be of any use to him. He had remembered it as large and beautiful.
Now he thought of it as small and cramped, too neat, too calculated, too little cognizant of unknown places, of the night places waiting beyond the day places, of the somewheres dropping from the open wombs of nowheres. He felt lost as he had not done since being with the lion.
'Maps,' he said softly. 'A map is the dead body of where you've been. A map is the unborn baby of where you're going.
There are no maps. Maps are pictures of what isn't I don't want it.'
'That's beautiful,' said the girl "There are no maps" What don't you want ?'
'My father's map,' said Boaz-Jachin. 'That's good,' said the girl. 'Is it yours ? Do you write ? It sounds like the beginning of a poem: "My father's map is..." What is it ?'
'His,' said Boaz-Jachin. 'And he can keep it.'
Conclusions
Hopefully this paper demonstrates that there is a practical approach to this very difficult problem and that much could be learned from such an exercise.
This sort of approach opens up for discussion the whole question of the value of the conventional western scientific approach of distinguishing sets of factors or conditions, and displaying them in a matrix or classifying them in some way. This widespread tendency detaches the observer from the phenomena in a manner 'which can conceal inability to relate to them, to fully comprehend them or to understand their relationship to other such sets. How can the " scientific", act of classification be related to the non-scientific need for representation and comprehension of complexity - given the variety of perspectives, information preferences, and tolerances for complexity ?
Clearly there is a paradox associated with such mapping in that the map is inadequate if the mapping activity does not figoure on it. Whilst amusing (see "paradoxes"), the paradox embodies problems which we resolve simplistically at present and thus suffer the consequences of the inappropriateness of our collective action. Alastair Taylor in concluding an article on Process and structure in Sociocultural systems (40) makes the point that:
" What we have to recognize is our shared involvement in a fundamental conceptual shift - a multirelational transformation from a nation-state paradigm progressively to a global construct comparable to the shift of perspective from the Mercator projection - rectilinear and emphasizing two-dimensional "flat" space - to, say, an orthographic projection, at once curvilinear and recognizing new spatial relationships. Perhaps the traditional concept of space itself requires to be assessed anew. The nation-state paradigm tended to view space as a void, an empty receptacle to contain pieces of "property", so that space was largely a matter of "place" and ~ location", and what lay beyond the property lines was either no-man's land or, alternatively, open to entrepreneurial grabs" and exploitation. But a very different way of perceiving space is to regard it as a plenum - an ordering constituent of a macrocosmic system in which field forces are omnipresent and omnio-operative, acting upon all material phenomena and maintaining a dynamic, energizing, as well as balancing, field it is in the context of a plenum or field we need to approach the ordering of our planetary and extraterrestrial spaces alike".
And, strangely enough, C.H. Waddington in his concluding remarks to the same book is forced into the geographical metaphor which is the theme of this paper in order to convey the complex notion of an epigenetic landscape in relation to evolution.
The question of the underlying kinds of metaphor through which the geographical ordering of the world is understood has recently been explored by Anne Buttimer stresses the need for new metaphors at this time (33).
There is a tantalisingly elusive relationship between the metaphor and current techniques for investigating and representing macrodynamics. This is itself interpreted in terms of catastrophe theory, namely the theory of the transitions of attractors (macrons) in a phase space, which is the basis of the geometry of macrons as it has developed so far (14). The interesting question is what macron patterns the mind chooses to recognize under different circumstances. The ramifications of this question are discussed elsewhere (1), and it is interesting that the same authors are cited by Erich Jantsch in considering the archetypal implications of the decomposition of a whole in relation, to modes of learning, evolution of consciousness, and methods of inquiry (41). For example von Franz, a Jungian scholar, states of the time-bound qualities of the first four numbers: "One comprises wholeness, two divides, repeats, and engenders symmetries, three centers the symmetries and initiates linear succession, four acts as a stabiliser by turning back to the one as well as bringing forth observables by creating boundaries, and so on ,' (42, p. 74). Jantsch notes that it is the transitions between these four basic qualities that symbolize how a gestalt system maintains its nature (to comprehension ?) in the presence of many temptations to become formalized. And it is the first step from one to two which constitutes the "original sin" of formal division which, according to Pankow (43, p. 35) "separates the two sides of complementarities and treats them as identities".
He relates this to the work of Spencer Brown (44) and concludes that "Therein lies a formal justification for the ultimate complementarily of the search without (in the physical world) and the search within (in our own experience), for what we approach, in either case, from one side or the other, is the common boundary between them (Spencer Brown, p. XIX)" (41). Such investigations suggest an intriguing link between the ecosystem design elements of this paper and the traditional notion of both Eastern and Western religious disciplines concerning the importance for the individual to cultivate an ¢¢ inner spiritual garden". Venturing further, one can see the challenge to society of the collective re-creation of a "Garden of Eden I" in the sense of this paper, which goes beyond that of simple metaphor, as a design challenge to science and art intertwined. Although, as A. Korzybski stressed, "the map is not the territory", the territory we know may certainly be construed as a very powerful map.
Developmental Landscapes
C H Waddington. Extract from "Concluding remarks" to Evolution and Human Consciousness (15).The first and most obvious type of change in an embryo is that it develops into an adult form; this is relatively long-lasting, but is in fact always undergoing slow processes of change, which lead eventually to senescence and death. This implies that the phase space in which the system is modeled contains a surface with a general slope which will guide any trajectory toward the adult state, and final death. However, we have also to take account of the fact that different parts of an embryo develop into different organs - liver, kidney, brains, muscles, and so forth. This situation can be described by supposing that superimposed on the general slope is a radiating system of valleys, which direct some trajectories to move along toward the kidney, another set to move along toward liver, and so on. An attractor surface modeled in such a manner is called an epigenetic landscape.
A description in these terms suggests many questions which it might be profitable to study. At what point do various valleys branch off from one another ? Do two valleys which have once become separate from one another ever later come together and fuse again ? But perhaps the most important questions for most practical purposes relate to the shapes of the valleys in cross section and the height of the mountain watersheds between them.
There is no reason why a valley should not have the shape of a very narrow canyon with precipitous and possibly high walls; or alternatively be characterized by the gentler contours, leading down to broad water meadows through which the river meanders, which are characteristic of what geologists would regard as an old, mature earth form.
To avoid having to use the only metaphorical name of a "valley", for what is really a characteristic of an attractor surface in a multidimensional space, I have coined the word "chreod". The cross-sectional shape of the chreod describes the reaction of the system to fluctuations affecting it. In a chreod with a canyon-like shape. It will be very difficult to divert the developing system from the very bottom of the valley. If this is done by a strong enough influence, the system will immediately find its way back to the bottom as soon as the influence ceases. Such a system is very stable in Holling's terms. On the other hand, if the chreod has the shape of a broad river floodplain, it will be very easy to divert the system from the very lowest point and it will return there only after meandering at random for quite some distance. This is a system with little stability in Holling's terms.
On the other hand, the resilience of the system depends not on the shape of the river valley or chreod, but on the height of the watersheds on each side of it. These indicate the maximum fluctuation which the system can absorb while remaining within the same chreod. Anything greater than this will push the system out of this chreod over the watershed. Now Holling suggests that it is very unstable systems (i.e., those corresponding to broad valleys), which are most resilient (i.e., have the highest watersheds). In a very general way, in epigenetic landscapes comparable to old matured earth forms, this may be true; but the connection is not necessary. In fact, in newly formed landscapes, developed for instance in regions of the earth recently subject to considerable uplift, one may find deep valleys which are very narrow in a cross section, such as the Grand Canyon. If one is trying to design and produce in a relatively short time a system in which it is of the first importance that it remain in its own chreod and not be pushed over a watershed into something quite different, then the simplest plan would be to make a very deep valley and a narrow one. The objection to this is not that its stability necessarily robs it of resilience, but that it allows very little variation among the individuals in a population passing along it. One could say that it produces a great deal of turbulence in the stream at the bottom. The social ideal would seem to be to allow a great deal of individual variation, in a maze of meandering streams in a flat valley bottom, but at the same time to have high watersheds on each side to prevent the system's being flipped out of that chreod into some unknown country.
References
1. Anthony Judge. Representation, comprehension and communication of sets. International Classification, 5, 1978, 3, pp. 12ff-133; 6, 1979, 1, pp. 15-25; 7, 1979, 2, pp. 92-103.
2. Anthony Judge. Information mapping for development. Transnational Associations, 31,1979, 5, pp.
3. Union of International Associations and Mankind 2000. Yearbook of World Problems and Human Potential. Brussels, Union of International Associations / Mankind 2000, 1976.
4. William Irwin Thompson. Darkness and Scattered Light. Doubleday, 1977
5. Anthony Judge. Transcending duality through tensional integrity. Transnationa/Associations, 30,1976, 5, pp. 248-265.
6. Anthony Judge. Viable need patterns and their identification through constraints on representation in 3 dimensions. (In: Proceedings of a workshop on human needs, Berlin, May 1978. Internationales Institut fur Umwelt und Gesellschaft 1979).
7. Anthony Judge. Organization and lifestyle design; characteristics of a nonverbal structural language. (Brussels, 1978).
8. Frances A Yates. The Art of Memory. Routlege and Kegan Paul, 1986.
9. G. Tucci. Theory and Practice of the Mandala. Rider, 1968.
10. Arie A Manten. A suggested growth model of science and implications for information transfer Joumal of Reseanch Communications Studies, 1, 1978, pp. 83-98.
11. Christopher Alexander. Notes on the Synthesis of Form. Harvard University Press, 1964.
12. Ref. 3 (Section K).
13. Ref. 3 (Section J)
14. Ralph Abraham. Vibrations and the Realisation of Form. In: Erich Jantsch and Conrad H Waddington (Eds). Evolution and Consciousness; human systems in transition. Addison-Wesley, 1976, pp. 134-14915. Erich Jantsch and C H Waddington. Evolution and Consciousness; human systems in transition. Addison-Wesley, 1976.
16. Richard Wilhelm (Tr.). I Ching or the Book of Changes. Routledge and Kegan Paul, 1950
17. Arthur M Young. The Geometry of Meaning. Delacorte Press, 1976.
18. L L Whyte (Ed.). Hierarchical Structures. American Elsevier, 1989, p. 11.
19. R Buckminster Fuller. Synergetics: explorations in the geometry of thinking. Macmillan, 1975.
20. M D Walker. Chladni Patterns; a study in symmetry. 1961.
21. Johannes Itten. The Art of Color: the subjective experience and objective rationale of color. Van Nostrand Reinhold, 1970
22. Anthony Judge. The harmony of interaction and the facilitation of network processes. International Associations, 26, 11, 1974, pp. 538-543.
23. R. Rolling. The role of graphic display of concept relationships in indexing and retrieval vocabularies. In: P. Atherton (Ed.), Classification Research. 1965. p. 295-325
24. D. E. Nicholson. Metabolic Pathways. University of Leeds (annually revised) (see Ref. 3, Annex 7).25. Gordon L Lippitt. Visualizing Change, model building and the change process. Fairfax, NTL Learning Resources Corporation, 1973.
26. Donella H. Meadows, Dennis L. Meadows, Jorgen Randers and William W. Behrens III. Limits to Growth: a rReport for the Club of Rome's Project on the Predicament of Mankind. Universe Books, 1974
27. L. Tesler, et al. A directed graph representation for computer simulation of belief systems. Mathematica/ Biosciences, 2,1/2, Feb. 1968, pp. 19-40.
28. Peter Johnson-Lenz and Trudy Johnson-Lenz. Conference tacilitation by computer-aided sharing. Transnational Associations, 29, 1977, 10, pp. 441-445.
29. UNESCO. SPINES Thesaurus. Paris, Unesco, 1976, 3 vols.
31. P. Gould and R. White. Mental Maps. Pelican, 1974.
32. D. C. Engelbart. Intellectual implications of multi-access computer networks. Stanford Research Institute, 1970.
33. Anne Buttimer. Musing on Helicon; root metaphors and geography. Geogratiska Annaler, 648, 1982, 2, pp. 89-96.
34. Union of International Associations. Yearbook of International Organizations. Brussels Union of International Associations, 1978.
35. F. J. Monkhouse and H. R. Wilkinson. Maps and Diagrams; their compilation and construction. London Methuen, 1973.
38. Peter Pearce. Structure in Natune as a Strategy for Design. Chrmbridge, MIT Press, 1g78.
37. E I Samurin. Geschichte der bibliothekarisch-bibliographischen Klassification. Verlag Dokumentation, 1977, 2 vols.
38. Ingetraut Dahlberg. Grundlagen universaler Wissensordnung. Munchen, Verlag Dokumentation, 1974.
39. Jerzy A Woiciechnowski (Ed). Conceptual Basia for the Classification of Knowledge (Proceedings of Ottawa Conference 1971). K G Saur, 1978.
40. Alastair Taylor. Process and structure in sociocultural systems. (In reference 15, pp. 189-184).
41. Erich Jantsch. Evolution: self-realization through self-transcendence. 1976 (In reference 15, pp. 37-70).
42. Marie-Louise von Franz. Number and Time: reflections leading towards a unification of psychology and physics. Rider, 1974.
43. Walter Pankow. Openness as self-transcendence (In reference 15, pp. 16-36).
44. George Spencer-Brown. Laws of Form. G. Allen and Unwiin, 1969